|
Rocks, fossils, and minerals |
Geologic hazards |
Rock geochemistry and dating |
Subsurface geology |
|
Geologic features |
Energy and mining |
Lidar |
Exploration Geophysics |
Rocks, Fossils, and Minerals
- Dinosaur Fossils
- Geologic Time
- Rock Types
- Hazardous Minerals
- Coal
- Metallic Minerals
- Nonmetallic Minerals
-
Up until 2012, no known dinosaur fossils were found in Washington State. But on the shore of tiny Sucia Island in the San Juan Islands, paleontologists (geologists who study past life) from the Burke Museum found one! They found a thigh bone of a theropod, a carnivorous (meat-eating) dinosaur (much like a velociraptor) that lived about 80 million years ago.
The fossil is currently on display in the lobby of the Burke Museum, and the lucky paleontologists have written up their preliminary findings in the journal PLoS ONE.
For more information about fossils in Washington, visit our Rockhounding page.
-
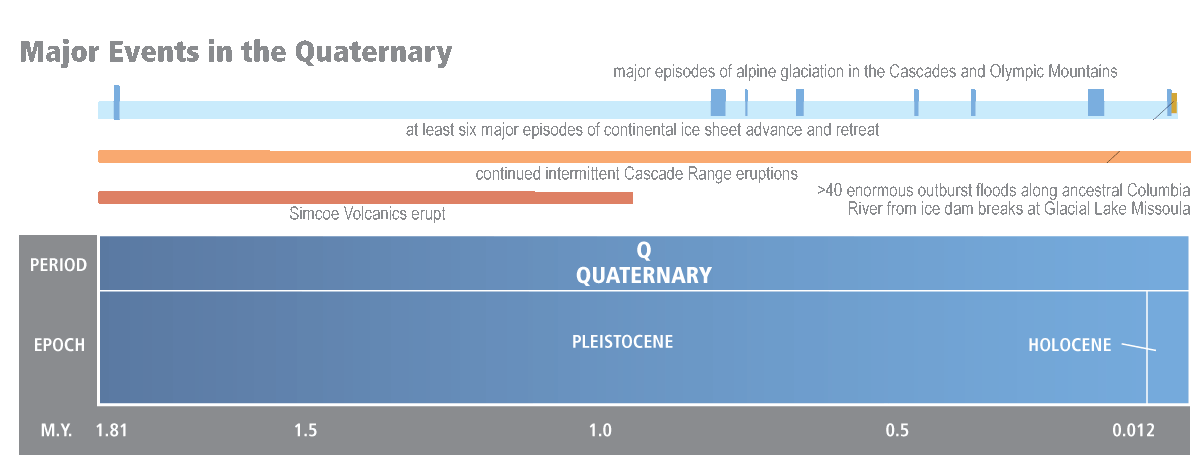
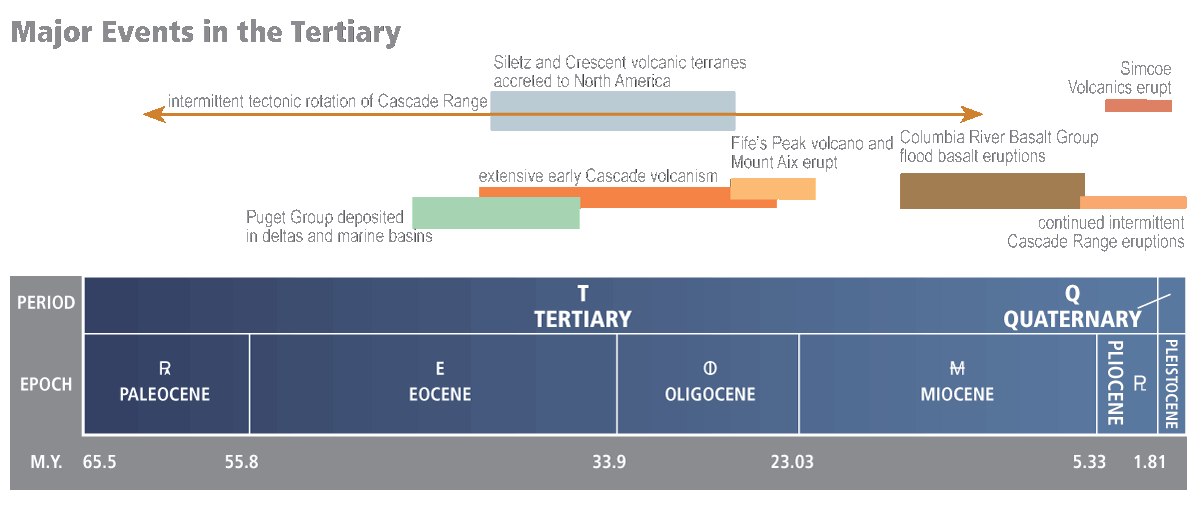
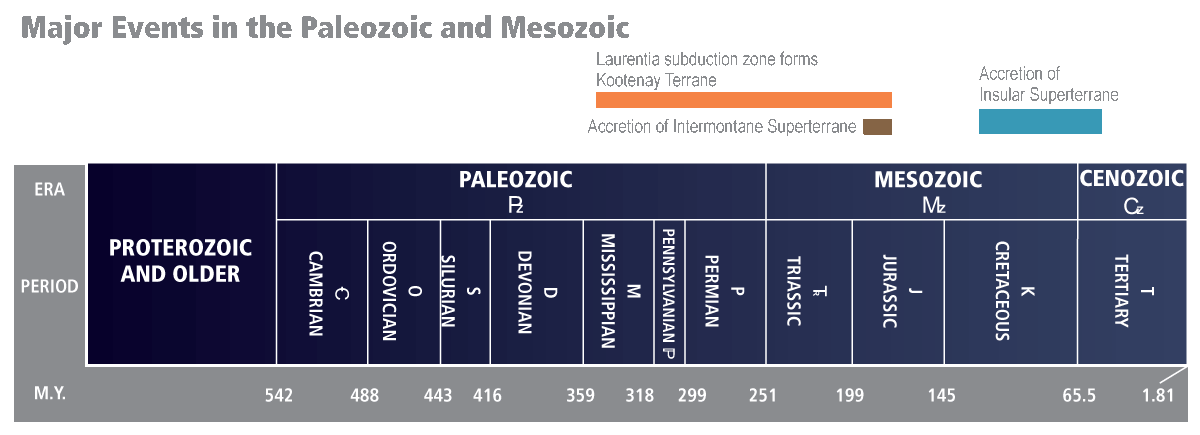
Geologic time scale showing eras, periods, epochs, geologic time symbols, and the major events that formed Washington.
-

The three main rock types: igneous, metamorphic, and sedimentary.
-
Hazardous minerals are those that contain the following naturally occurring elements: arsenic, asbestos, mercury, and uranium.
Asbestos
Asbestos is the general term for a number of minerals belonging to the serpentine and amphibole groups that have similar properties. Asbestiform minerals are composed of very thin, long fibrous crystals, and it is this fibrous nature that makes them dangerous. Asbestos is frequently associated with serpentinite and partially serpentinized ultramafic/ultrabasic rocks (however, not all ultrabasic rocks are serpentinite bearing).
Mercury
Mercury, called quicksilver by miners, is silver to white, and the only metal which is liquid at room temperature. It is typically extracted from the mineral cinnabar by heating the crushed ore.
Mercury is highly toxic and can be absorbed through the skin or inhaled as mercury vapor. Mercury may also enter the food chain and become a health hazard to animals and humans.
Arsenic
Arsenic is found in many rocks and minerals and is generally associated with sulfur. The most common arsenic minerals are arsenopyrite and the sulfides realgar and orpiment.
These minerals can cause respiratory problems when inhaled, particularly at mine sites that are popular for motorized recreational vehicle use. Additionally, water discharged from metal mine openings may contain these same minerals in solution and present a health hazard to humans and animals. Arsenic is especially dangerous when it contaminates groundwater and poisons drinking water.
Uranium and Radon
Radon is produced by the natural radioactive decay of uranium (and (or) thorium) and is particularly associated with uraniferous two-mica granites.
Radon is carcinogenic and a prominent cause of lung cancer. Radon is colorless, odorless, and tasteless, making it exceptionally hazardous, as its presence is revealed only by specific detectors.
-
Coal is a sedimentary rock that is composed mainly of carbon. Coal is formed through the metamorphism of peat over millions of years. Peat is formed in bogs and marshes from plant matter accumulated over thousands of years. As the peat is metamorphosed through high pressure, coal is formed in three distinct grades: lignite, bituminous, and anthracite coal.
-
Metallic minerals are elements or compounds that are generally hard, shiny, malleable, and usually have good electrical and thermal conductivity and high density. These characteristics make them desirable for use in most of the products we use every day.
-
Geologists use the term 'Industrial Minerals' to describe nonmetallic minerals that have economic or industrial uses. Their characteristics and means of formation are highly variable.
Geologic hazards
- Earthquakes
- Active Faults and Folds
- Paleoseismic Trenches
- Historical Earthquake Damage
- Earthquake Site Class
- Landslides
- Tsunamis
- Volcanoes and Vents
- Liquefaction
-
An earthquake occurs when rock inside the Earth moves or breaks. This movement happens because stress builds up as tectonic plates move. The process of breaking and moving rock releases a large amount of energy that travels through the Earth as seismic waves.
More information can be found on our Earthquakes and Faults webpage.
-
For WGS, active means that a fault or fold has evidence for movement within the Holocene time period (since about 12,000 years ago). It usually also means that there are earthquakes (even small ones) documented to have occurred on the fault. Other faults that have evidence for movement within the Quaternary (last 2 million years or so) are also of concern.
Washington has dozens of faults, fault zones, and folds with evidence of movement in the Quaternary. Some of these features are in remote areas. Others, like the Seattle Fault and southern Whidbey Island fault zone, cross under major cities and pose a significant hazard.
More information can be found on our Earthquakes and Faults webpage.
-
Geologists use many techniques to located Quaternary-aged faults. Typically, once a fault feature has been identified in the landscape (usually with lidar), a trench is excavated across it in order to determine the direction of fault movement, the timing of earthquakes, and the recurrence interval of earthquakes. Finding faults and knowing how often they rupture is one of the most important tasks to keep society safe from these hazards.
More information can be found on our Earthquakes and Faults webpage.
-
After earthquakes, geologists go to the damaged areas to document effects of earthquakes. Often, these observations are used to inform building codes and improve building retrofit designs.
More information about earthquakes can be found on our Earthquakes and Faults webpage.
-
Earthquakes cause damage by moving and shaking the ground, sometimes for several minutes. The shaking can damage or destroy buildings and other infrastructure.
Soils can be classified by the National Earthquake Hazard Reduction Program (NEHRP) seismic site class of an area. Site class is a simplified method for characterizing the ground-motion amplifying effects of soft soils during an earthquake by evaluating the relation of average shear-wave velocity in the upper 100 feet of the soil-rock column to the amplification of shaking at ground surface. Shear waves are the earthquake waves that create the strongest horizontal shaking and are the most damaging to buildings and structures. Site class provides some measure of the potential for strong shaking in a particular area during an earthquake.
Site class B represents a soft rock condition, where earthquake shaking is neither amplified or reduced by the near-surface geology. Site classes C, D, and E represent increasingly softer soil conditions which result in a progressively increasing amplification of ground shaking. Site class F is reserved for unusual soil conditions where prediction of the amplification of earthquake shaking can only be determined by a site-specific evaluation. On this map we delineate areas of peat soil as site class F. This information is useful when deciding where and how to build.
For more information about ground shaking, go to our Faults and Earthquakes webpage.
-
A landslide generally refers to the downhill movement of rock, soil, or debris. The term landslide can also refer to the deposit that is created by a landslide event.
More information can be found on our landslides webpage.
-
A tsunami is a powerful and destructive natural force. It’s a series of extremely long waves caused when an event, such as an earthquake, suddenly shifts water in the ocean or in a lake. A tsunami radiates outward in all directions from its source and can move across entire oceans in less than a day.
For more information about tsunamis, visit our webpage.
-
A volcano is an opening in the surface of a planet (or moon) that allows hot material to escape from the magma chamber below the surface. When the hot material, such as lava, ash, and gas make their way to the surface, the volcano erupts. The style of eruption depends on the type of volcano. Eruptions can be explosive, sending hot mixtures of ash and gas high into the sky; or they can be calm, only sending small amounts of lava down the slope.
There are over 500 volcanic vents in Washington State. A volcanic vent is an opening on the Earth's surface where magma and gases are emitted. All volcanoes have a central vent which is connected to the subsurface magma chamber that supplies volcanic materials. Different types of volcanoes produce different kinds of lavas. The volcanoes in Washington produce lavas mainly composed of dacite or andesite.

For more information about volcanoes, visit our volcanoes page.
During an earthquake, some soils will behave like liquids—a behavior called liquefaction. Liquefaction occurs when water-saturated sandy soil loses strength during severe shaking and behaves like quicksand. Movement of liquefied soils can cause sand blows, rupture pipelines and waterlines, move bridge abutments and road and railway alignments, and pull apart the foundations and walls of buildings.
For more information about liquefaction, go to our Faults and Earthquakes webpage.
Rock geochemistry and dating
- Geochronology
- Argon
- Uranium-Lead
- Radiocarbon
- Luminescence
- Fission Track
- Other Radiometric Analyses
- Index Fossils
- Geochemistry
-
Geochronology is the analytical determination of age of a sample of rock to establish its age of formation or to provide limits on a geological event. Absolute methods are usually radiometric, meaning they use the predictable decay of radiogenic isotopes with known half-lives to calculate the age of the sample. However, other methods use other properties, such as observable light emittance or tree rings to better determine age. Relative dating techniques bracket the time frame of formation, and include fossil assemblage identification, paleomagnetism, magnetostratigraphy, chemostratigraphy, or cosmogenic nuclide geochronology.
-
Argon-argon radiometric analyses use irradiation of a sample to convert the stable 39K to the radioactive 39Ar. During subsequent incremental heating, each step releases argon having a specific 40Ar/39Ar ratio. Using a half life for 40K of 1.25 billion years with the measured 40Ar/39Ar ratio and irradiation parameter values, the age of the sample can be calculated.
Potassium-argon dating relies on the relative proportions of 40K to 40Ar within a sample; this method has been largely superseded by the 40Ar/39Ar method, because the K-Ar results may be too old due to excess argon or too young due to argon loss during weathering and alteration. In both cases, the age of the sample represents the age in which closure temperatures for specific minerals within the rock were met, and may therefore represent a crystallization age, a metamorphic age, or an age of faulting.
This method can be used on many rock types as young as a few thousand years old.
-
Uranium-thorium-lead radiogenic isotope age determinations are made by measuring the abundances of two uranium isotopes (238U and 235U) and one thorium isotope (232Th) relative to the abundances of their daughter lead isotopes 206Pb, 207Pb, and 208Pb, respectively, using their respective decay constants. The ratio of 207Pb to 206Pb is also measured, which may yield the closest age determination of crystallization, because this measurement is not affected by U or Pb loss as with uranium-dependent analyses. Measurements are typically performed on uranium-enriched mineral separates, primarily zircon and apatite. Ages for these analyses are determined through use of concordia or isochron diagrams. Recent improvements in the technique allow individual grains or fragments of grains to be analyzed on mass spectrometers, rather than bulk analysis of dissolved mixtures of detrital minerals. This reduces the chance for anomalously old age determinations. Thus, recent analyses are considered to be generally more reliable than older measurements. Pb-alpha analyses have been compiled into WGS datasets, but the method has been largely superseded by the isotopic U-Th-Pb method.
Uranium-lead-based analyses are typically used on igneous rocks older than about 1 millions years. Uranium-thorium-based analyses can be used on carbonates and fossils over 700,000 years old.
-
Radiocarbon analysis measures the decay of the radioactive carbon-14 isotope (14C) to estimate the age of organic material. This works because when organic matter forms, it absorbs 14C in proportion to the environmental abundance of 14C, and once absorbed, the 14C decays at a predictable rate. The 5,730 year half-life of 14C, the assumed initial abundance of 14C in the sample, and the remaining 14C decay activity are used to calculate the age.
The results of this method are refined by correcting for known variations in the radiocarbon content in the atmosphere in the past. Additionally, the date may be further refined by correcting for isotope fractionation based upon the abundances of 12C and 13C in the sample.
Radiocarbon analysis is performed on organic material younger than 45,000 years old. Age determinations of tree samples may at times be refined by dendrochronology, if a fully anchored chronology is available.
-
Luminescence dating is the estimate of the amount of time elapsed since an earth material was either fully exposed to sunlight (in the case of sediment) or heated (in the case of lavas). However, if the sample wasn't fully saturated, it can yield too young an age. This methodology measures the photons emitted from an irradiated material when reheated or stimulated with light. The amount of light produced from the sample is proportional to the radiation dose accumulated when compared to a calibrated sample.
Types of luminescence analyses include optically stimulated, infrared, cathodoluminescence, and thermoluminescence. The anlayses are generally performed on silt and sand samples between 100,000 and 350,000 years in age.
-
The fission-track method of dating operates under the assumption that spontaneous fission of 238U and other isotopes generate fission tracks in a crystal lattice, and uses the observed track density and measured U concentration within a mineral separate, along with decay constants for spontaneous fission, to determine the age of the sample.
Generally, this analysis is performed on zircon and sphene, due to their excellent track retention properties, although it is also performed on other mineral separates, such as apatite, quartz and plagioclase, or on glass. This analysis is typically performed on relatively young samples, due to the effects of fading or annealling of tracks upon reheating. This method can also be used to determine thermal histories of rocks, because tracks are erased within different minerals at different temperatures.
-
The Rb-Sr (rubidium-strontium) radiometric method employs the decay of 87Rb to stable 87Sr to determine the age of a mineral separate or bulk rock sample by using abundances of both Rb and Sr and the 87Sr/86Sr ratio, assuming an initial 87Sr/86Sr ratio, and assuming re-heating did not occur after crystallization. Age and uncertainty are assigned by fitting isochrons to the analytical data.
This method is most suitable for determining time of crystallization in acidic and intermediate igneous rocks, although it can also be used to determine timing of metamorphism in metamorphic rocks, and it may be able to determine timing of source rock crystallization or metamorphism in detrital grains within sedimentary rocks.
Conversely, rare earth element samarium (Sm) and its daughter element, neodymium (Nd), are most useful in determining ages of ultramafic and mafic igneous rocks. The decay of 147Sm to 143Nd, using the corrected ratio of 143Nd and 144Nd for reference, can be used to generate the slope of an isochron when measured in a suite of related samples to determine age.
-
Fossils are traces of microscopic to megascopic remains of plants or animals found within sedimentary rocks, and their identification and association with a known period of time in the stratigraphic record led to the original development of the geologic time scale. Fossils may consist of partly to wholly remineralized portions of the plant or animal, or may merely be an impression or cast of the organism. The specialized branch of paleontology involves using detailed stratigraphic information and the representative fossil assemblages to determine the relative age of a formation. Empirical radiometric methods of determining age are used to further refine age estimates provided by the fossil record.
-
Geochemistry is the study of the chemicals found in rocks, minerals, and fluids. Elements are all around us and are often found as compounds in the environment. When the elements silicon (Si) and oxygen (O) combine, they create an oxide. Oxides are the building blocks which make up the planets and solar systems, and are known as "major elements". There are also "trace elements" which are found in low concentrations in rocks. By studying these major and trace elements, scientists can track the geologic processes that have created or changed the rocks and minerals that we see today.
There are a variety of ways that scientists analyze a rock or mineral for its chemistry. The two most common methods are X-ray diffraction and mass spectrometry.
X-ray diffraction
With X-ray diffraction, X-rays are directed towards and are absorbed by the sample. The sample then re-emits its own X-rays that are collected by a detector. The energy and wavelength of the collected X-rays are characteristic of the type and concentration of elements in the sample. This is a non-invasive technique that can be used on delicate objects as no sample is lost or changed in the process.
Mass spectrometry
Mass spectrometry involves crushing or dissolving a sample to analyze its chemistry. The sample is superheated into a plasma by lasers or ionization if solid or liquid. The plasma is then directed through a tube bent around a magnet. The magnet attracts each element towards it differently depending on the charge of the element. Where and how often an individual atom strikes a detector informs scientists both what and how much element is in the sample. This is an invasive technique that will destroy the sample.
Subsurface geology
- Boreholes
- Shear Wave Data (Vs30)
- Cross Sections
-
The different types of boreholes are as follows:
Geotechnical boreholes: Boreholes and pits created with the intent to gain a detailed understanding of the subsurface lithology and soil or rock properties therein. These records have additional data beyond lithologic descriptions including penetrometer resistance, shear and strength tests, density measurements, etc.
Lithologic borings: Boreholes drilled solely for the purpose of identifying subsurface lithology.
Test pits: Generally shallow excavations with either hand tools or mechanical equipment that are typically less than 20 feet in depth though may expose a greater area or "working face" to observe the subsurface lithology.
Water wells: Boreholes drilled with the purpose of extracting or monitoring groundwater. These records often provide detailed hydrologic data including depth to groundwater, flow rates, and draw-down testing that may be used to better understand they hydrogeology of an aquifer system. Chemical testing for potentially hazardous pollutants may also be included for some wells, particularly those focused on monitoring groundwater rather than extraction.
Learn more about subsurface data on our webpage.
-
Vs30 is the speed at which seismic shear waves travel through the uppermost 30 meters of substrate at the Earth's surface. Seismic velocity data consist of P-wave (primary wave) and S-wave (shear wave) measurements. Shear wave data are used to determine the National Earthquake Hazard Reduction Program (NEHRP) site class at a given location (a measure of how much underlying soils will amplify seismic waves). The data are also used to help construct accurate ShakeMaps in Washington and Oregon and to refine ground-motion prediction equations for Pacific Northwest earthquakes.
-
A geologic map can only show what is exposed at the surface of the Earth. To show what lays beneath our feet, geologists make cross sections. Cross sections are imaginary slices into the earth that show how rock units or deposits are arranged below the surface. Geologists may use structural measurements, data obtained from water well or geotechnical borings, and various types of geophysical information to help determine the geometry of the geologic map units at depth.
Geologic features
- Faults and Folds
- Mima Mounds
- Parts of a Geologic Map
- Paleosols
- Glacial Features
- Dikes
-
Geologic structures, such as faults and folds, are added to geologic maps to show where the Earth's crust has bent or broken.
Faults
Because of plate tectonics, formations that make up the Earth's crust are broken along faults. The past motion along faults can be measured from centimeters to kilometers depending upon the age and tectonic setting of the fault. Repeated movement along the fault pulverizes the surrounding rock, producing what is termed "fault gouge".
Faults that break Quaternary deposits are considered active or potentially active, depending upon when the fault last moved. Active faults have the potential for rupture during earthquakes. Geologists study these features in detail to estimate the frequency and magnitude of earthquakes that have been produced along them.
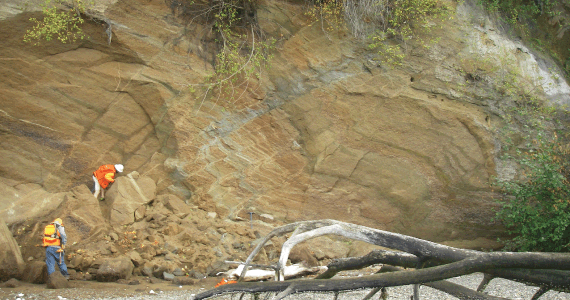
A beach-side outcrop of young, unconsolidated deposits disrupted by a strand of the Dabob Bay fault zone. This fault zone was recently found on the western shore of the Toandos Peninsula, near Brinnon.
Folds
Folds are commonly shown on geologic maps. A fold occurs when originally flat surfaces, such as sedimentary strata, are bent or curved as a result of tectonic movements. Folds can be very small, on the order of centimeters to meters across, or they can be so large that they are viewable from space!
-
Mysterious features in the landscape can be found in the southern Puget Lowland, called Mima mounds. Named for the type locality at the Mima Mounds Natural Area Preserve, Mima mounds are circular, chest-high dome-shaped mounds found in randomly spaced clusters, and are composed of dark gravelly soil.
There are many theories as to how the Mima mounds formed. Some postulate they formed from giant burrowing pocket gophers, others think they were created during earthquakes, and another contingent supports the idea that the clay in the soil shrinks and swells with varying water conditions. Weirdly, in the southern Puget Lowland, most of the Mima mound fields lie solely within recessional glacial outwash deposits. Whatever their cause, they're pretty fascinating features.


-
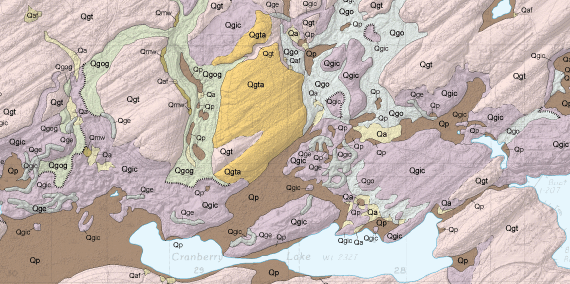
A geologic map is a special-purpose map made to show geologic features. Geologic maps show the types and ages of rocks and deposits that are found at or near the Earth's surface. This is a fundamental tool for earth scientists. Maps show map units, faults and folds, cross sections, and other regional or local features, depending on map scale. Map data is typically shown on a base map, which shows topography, water features, mountains, and other landmarks.
Geologic Units
A geologic map classifies rocks and deposits into geologic map units, that are displayed as colored or patterned areas on the map based on unique rock type, age, or depositional setting.
In this example, each colored polygon represents a geologic map unit. The unit symbols labelling each polygon signify the units' age, depositional setting, rock type, and formal or informal name. For example, the unit symbol "Qgtv" tells us that its age is Quaternary (less than about 2 million years old), it is composed of glacial (g) till (t), and is part of the Vashon Stade (v).
Faults and Folds
Geologic structures, such as faults and folds, are added to geologic maps to show where the Earth's crust has bent or broken.
Faults
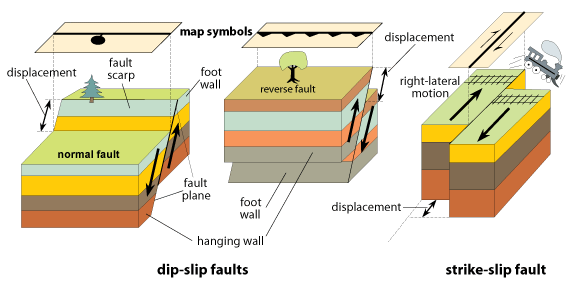
Faults can be classified into three major categories, based on their sense of displacement: normal, reverse, and strike-slip. Different map symbols are used to mark the different types of faults.
Folds
It is the trace of the "fold axis" of moderately large to large folds that are commonly displayed on geologic maps.
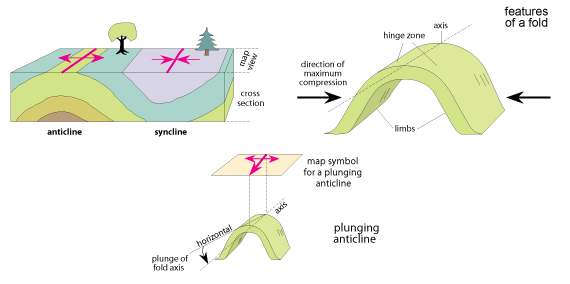
Geologists map the trace of the fold where it meets the Earth's surface.
Attitude Measurements
Geologic maps frequently have little perpendicular symbols with numbers next to them. These symbols denote the orientation of planar and linear geologic features such as bedding, lineations, foliations, joints, faults, or other types of fabrics measured in rock outcrops. Geologists usually take these measurements using Brunton compasses.
The long axis of the attitude symbol is rotated on the map to show the strike direction or bearing of the feature. The value next to the symbol denotes the dip or plunge of the feature.

Schematic diagram of strike and dip.

Schematic diagram of bearing and plunge.
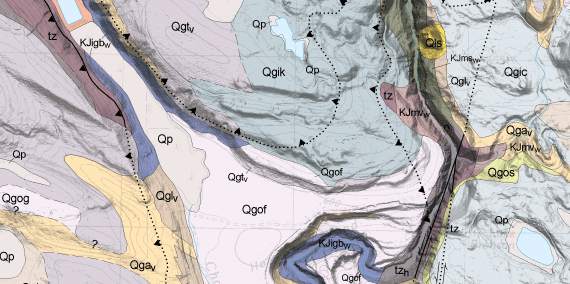
Contacts
Contacts are lines that geologists use to mark the boundaries of geologic units, and line symbology will usually denote the confidence the author had in the location or identification of that contact. Solid lines denote higher confidence whereas dotted lines denote more uncertainty. Sometimes, the contact between two units is actually a fault.
Ice Limits
During the Pleistocene, glaciers covered much of western and northern Washington. Geologists can sometimes find evidence that locates the southern limit of glaciation. These locations are depicted as lines on some geologic maps.
Point Features
Cartographers use points on maps to denote localized features. On a geologic map, these locales can include: geochemistry or geochronology sample locations, important geologic units too small to show at map scale, wells or borings, or paleomagnetic sample locations.
Linear Features
Cartographers use lines on maps to denote localized linear features that add context and meaning. On a geologic map, these lines can represent: eskers, glacial ice limits, terrace or fault scarps, cross section lines, shorelines, streams, supplementary contours, geophysical survey lines, flow lines on lava flows, and landslide movement directions.
Dikes
Dikes are vertical or near-vertical tabular igneous intrusions that cut through bedrock, forming linear trends across the Earth's surface. Dikes are typically represented on a geologic map by a line.
Other Polygons
Sometimes, geologists need to show the aerial extent of something that's not a geologic unit. Examples include areas of mineralization or alteration, fault zones, outcrops, geomorphic features, and mineral resources.
These polygons are typically overlain on top of geologic units so that both can be viewed simultaneously.
Mapping Scale
Maps are made at varied scales. Map scale determines how much territory is shown by a map. For instance, at a scale of 1:100,000, one inch on the map equals 100,000 inches in the real world—about 1.6 miles.
In Washington State, common geologic map scales are 1:24,000, 1:100,000, and 1:250,000. All of Washington has been mapped at 1:100,000 and 1:250,000 scales, but most of the state remains unmapped at the more detailed 1:24,000 scale. Land owners, planners, decision-makers, and others commonly need information at 1:24,000, or even at a more detailed scale.
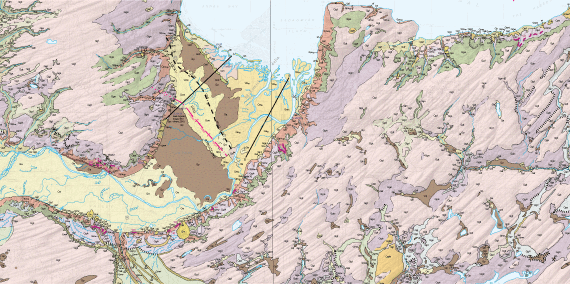
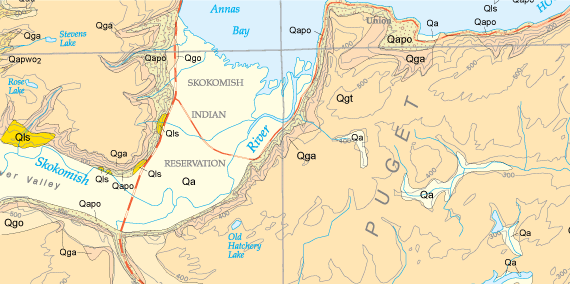
Use your mouse to hover over the photo to compare geologic mapping of the Skokomish-Union area in Mason County at various scales. The left map was mapped at 1:100,000 scale and the right map was created at 1:24,000 scale.
-
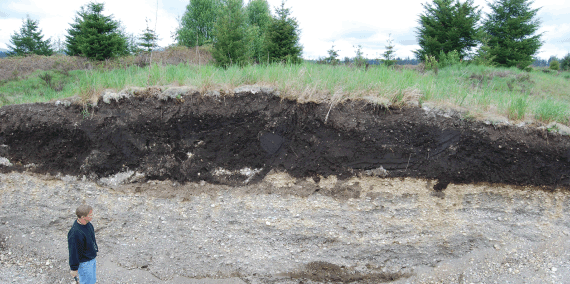
Paleosols are fossil soils. Soil exposed at the surface can be buried by sediment or volcanic deposits and preserved. They record the climate and vegetation of the time period in which they were deposited, which may be quite different than the climate of today. In western Washington, paleosols are typically rust colored when exposed in outcrop.
-
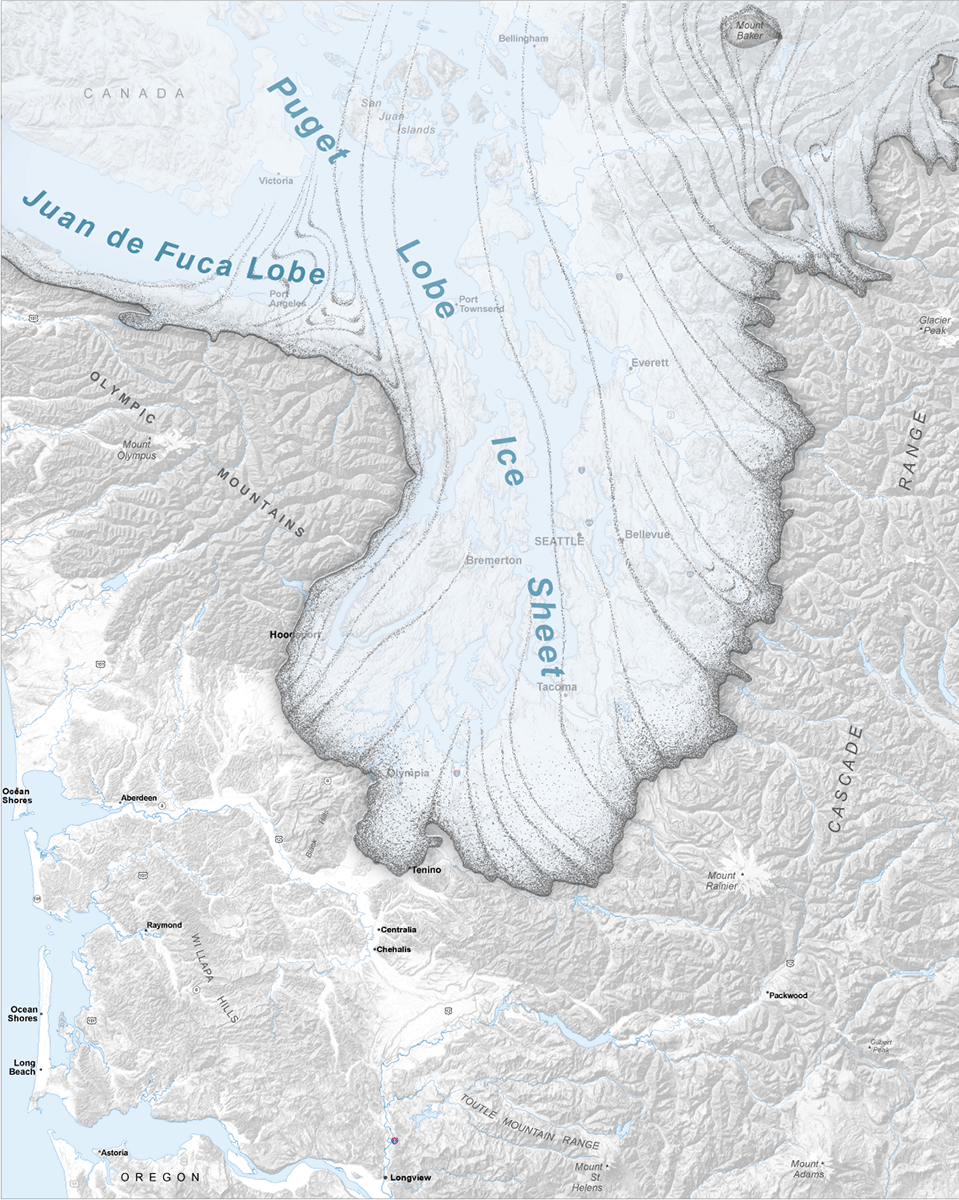
Extent of the Puget Lobe of the Cordilleran Ice Sheet during the latest ice advance.
Ice sheets are glaciers that can be thousands of feet thick and are exceptionally talented at transforming landscapes. It was during the Vashon Stade (the latest ice advance and retreat about 15,000&ndash–12,000 years ago) that the Puget Lowland got the extreme make-over that we see today.
As glaciers scour the landscape they flow over, sediment is collected and transported within, beneath, and above the ice. Glaciers are capable of moving the smallest of clay particles to very large boulders. Sediment is also transported in milky, silt-laden meltwater streams in front of the glacier's toe.
The glaciers left behind many features in the landscape that are fun to identify.
Fluting
A fluted ridge (or a drumlin) is a geologic feature, where an otherwise jagged ridge has been smoothed into an elongated teardrop shape. Flutes align with the direction of the ice flow and are evident all across the Puget Lowland.
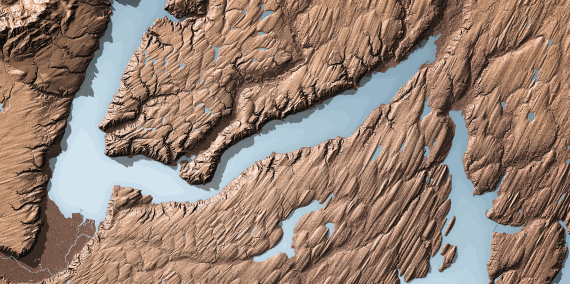
The above example shows a strong fluting fabric in the terrain near the mouth of the Skokomish River in the Hood Canal area.
Moraines
Toward the edge or the terminus of the glacier, sediment is also deposited in large curvilinear hills that are aligned parallel to the edge of the ice sheet, called moraines. Moraines physically mark a period of stagnation for the glacier, where it neither advances nor retreats. During this time of stagnation, the glacier deposits sediments at its terminus moraine. Some moraines can be hundreds of feet tall.

Railroad Grade, near Mount Baker, is a long sinuous moraine formed by alpine glaciers. Photo credit: brewbooks on Flickr (Creative Commons)
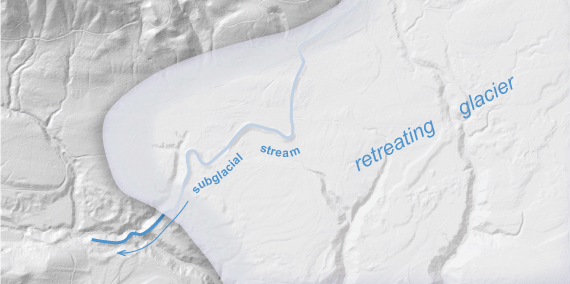
Eskers
Eskers are features that are often found near the terminal moraines. Eskers are formed when sub-glacial rivers transport pebble to cobble sized gravel, and the deposits are exposed once the glacier has retreated. The result is a sinuous ridge of gravel that runs roughly parallel to the direction of ice flow.
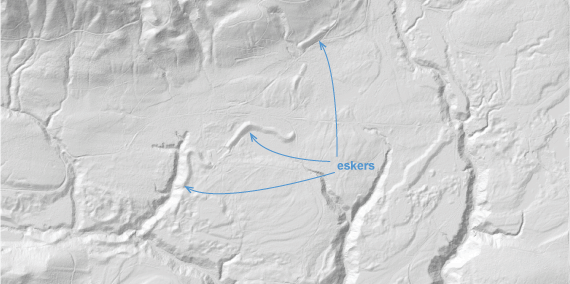
Use your mouse to hover over the photo.
Kettles
Glacial kettles are small depressions that form when a retreating glacier leaves a bit of ice behind which then becomes buried by sediment shed from glacial streams. When the block of ice melts, the ground collapses, forming a kettle.
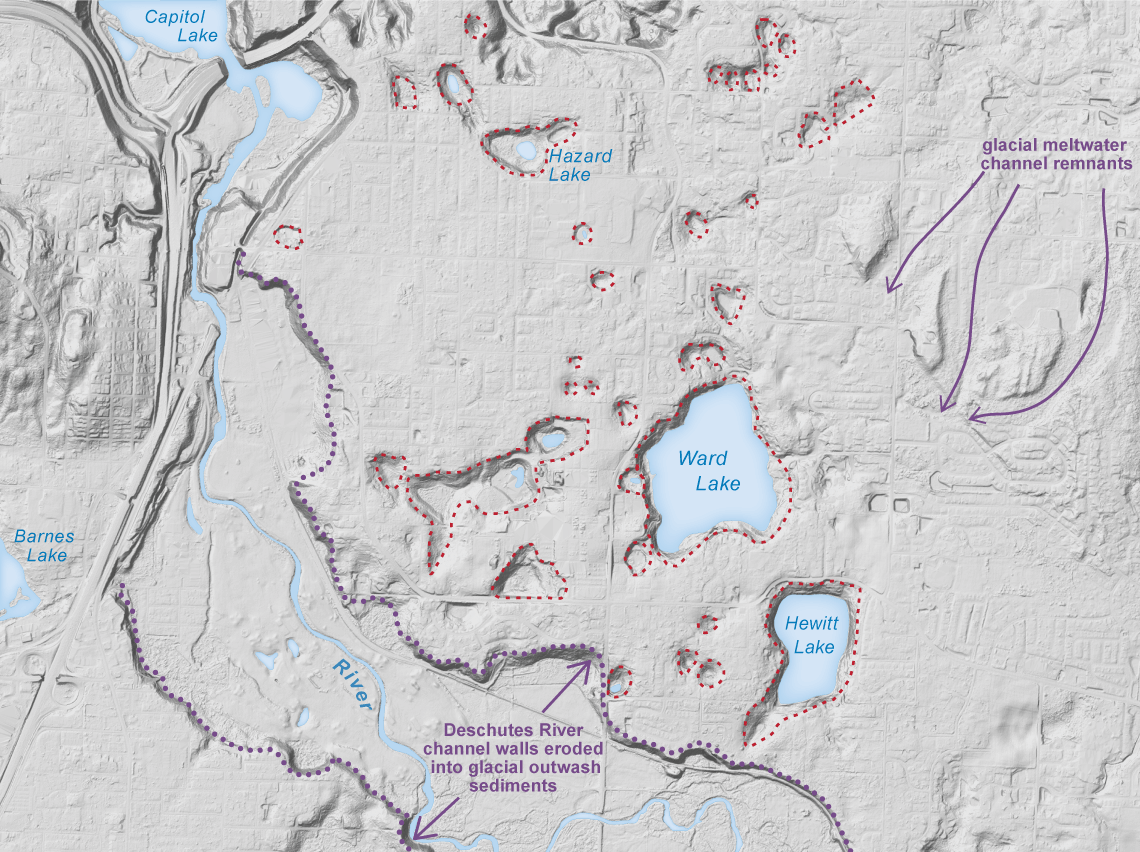
The Budd Inlet Kettle Train, just south of Olympia, is a cluster of kettles where many ice blocks were buried by sediment from the receding glacier. Kettles are outlined with dashed red lines.

Glacial Till
Glacial till (diamictite) is unsorted glacial sediment. It is deposited directly at the base of glacial ice. Generally, it is composed of hard-packed clayey silt mixed with numerous irregularly shaped cobbles and boulders that were entrained in the ice as it plucked and abraded the surface.
Glacial Outwash
Glaciers produce a lot of meltwater, which subsequently transports vast amounts of sediment. Outwash is a general glacial term describing silt, sand, and gravel deposited in front of a glacier by the meltwater. The sediment is transported either within glacial streams or directly into lakes in front of the glacier's toe. Stream-transported outwash is typically found in broad outwash plains, which are braided stream complexes.
Outwash deposited in front of an advancing glacier will be subsequently overridden by the ice and will become compacted, whereas outwas deposited during glacial retreat does not get overridden and is generally less compacted.
Kames and Kame Terraces
Kames are the remnants of sediment that were deposited in depressions on the glacier. These sediments collapse once the ice has melted.
Kame terraces are geomorphic landforms left behind when glacial ice buttressed the deposition of sand and gravel along the sides of a glacier and subsequently melted. Kames look like long flat benches and are found along the sides of glaciated valley walls.
Alpine vs. Continental Glaciation
Geologists use the term 'continental' glaciation to refer to the widespread ice sheets that repeatedly advanced and retreated during the last ice age. In Washington, ice sheets up to 1 mile thick covered all of northern Washington, with a longer lobe reaching southward to Tenino in the Puget Lowland.
Alpine glaciation refers to the localized advance and retreat of ice due to cold climates in alpine settings. Numerous alpine glaciers are long-lived features, covering much of Washington's high elevation peaks. These glaciers expand their footprint during continental ice sheet advances.
More Information
Check our page on Washington's glacial geology for more information about how Washington was shaped by glaciers.
-
Dikes are vertical or near-vertical tabular igneous intrusions that cut through bedrock, forming linear trends across the Earth's surface. Dikes are typically represented on a geologic map by a line.
Energy and mining
- Oil and Gas Wells
- Active Surface Mine Permit Sites
- Geothermal Well Data
- Geothermal Direct Use Well Data
- Thermal and Mineral Springs
- Geothermal Favorability
-
Oil and gas are naturally occurring resource deposits formed as a result of organic material that is buried and then subjected to heat and pressure. Oil seeps in Washington were first reported in 1881 along the sea cliffs on the west side of the Olympic Peninsula. Natural gas seeps associated with mud cones and mounds were also reported in this same general area. We access these resources by drilling wells. In 1965, the Jackson Prairie natural gas storage project was developed, which remains the Northwest's largest natural gas storage facility.
A total of 862 exploratory wells have been drilled in Washington to date, with 249 reporting shows for oil and gas.
For more information about oil and gas, go to our webpage.
-
The extraction of materials from a site such as sand and gravel, stone, clay, coal, industrial minerals, metallic substances, peat, or topsoil requires an active reclamation permit. Surface mines are regulated under the Surface Mine Reclamation Act enacted in 1971, which requires a permit for each mine with more than 3 acres of disturbed ground or a high wall that is both higher than 30 feet and steeper than 45 degrees. The Surface Mine Reclamation Act was amended in 1993 to ensure that every mine in the state is thoroughly reclaimed.
The Department of Natural Resources is responsible for seeing that reclamation is completed after surface mining and has exclusive authority to regulate mine reclamation and approve reclamation plans. The basic objective of mine reclamation is to re-establish the vegetative cover, soil stability, and water conditions at the site. Mines may be reclaimed for fish and wildlife, grazing, forestry, wetlands, residential, and commercial and industrial uses. Mine operation, which includes all mine-related activities except reclamation, is specifically regulated by local governments or state and federal agencies, exclusive of the Department of Natural Resources.
For more information about the Surface Mine Reclamation process, or to access fee schedules or forms, go to our webpage.
-
Much of our geothermal data is obtained from temperature-gradient wells or water wells where logging equipment was used to gather detailed temperature profiles. A temperature gradient is then calculated from this data in degrees C per kilometer.
Water well records where temperature was recorded can also be used to estimate a representative temperature-gradient using an assumed surface temperature in the area of the well. These data typically hold less scientific value compared to geothermal wells logged specifically for temperature data.
For more information about geothermal resources in Washington, visit our webpage.
-

General schematic of direct-use, courtesty of the U.S. EPA.
Heat from under the earth's surface can be harnessed and used in many residential and industrial ways. This is done by using a direct-use geothermal heat pump and either an open- or closed-loop system. Closed-loop systems feature loops of piping filled with a mixture of water and refrigerant. These loops are buried (either vertically or horizontally) in the ground and connected to a heat pump at the surface. The pump forces the water mixture underground where the earth's temperature heats it. This heated water is then returned to the heat pump where it can be used to heat or cool a building.

General schematic of closed-loop system used for heating, courtesty of the U.S. EPA.

General schematic of closed-loop system used for cooling, courtesty of the U.S. EPA.
Open-loop systems work in much the same way except that the water is not contained within the system. The hot or cold groundwater is extracted by a well, run through a heat pump, and then discharged back into the earth by another well. This system is less desirable due to the need to discharge water and the effects of untreated water on the mechanical parts of the pump.

General schematic of open-loop system, courtesty of the U.S. EPA.
-
Washington State has many cold, thermal and (or) mineral springs as well as fumaroles. Mineral springs are naturally occurring springs that contain dissolved minerals. Thermal or hot springs are heated geothermally and may be as small as a single seep to very large in size. Fumaroles are openings on the earth's surface which emit steam and other gases.
More information about geothermal resources can be found on our geothermal webpage.
-
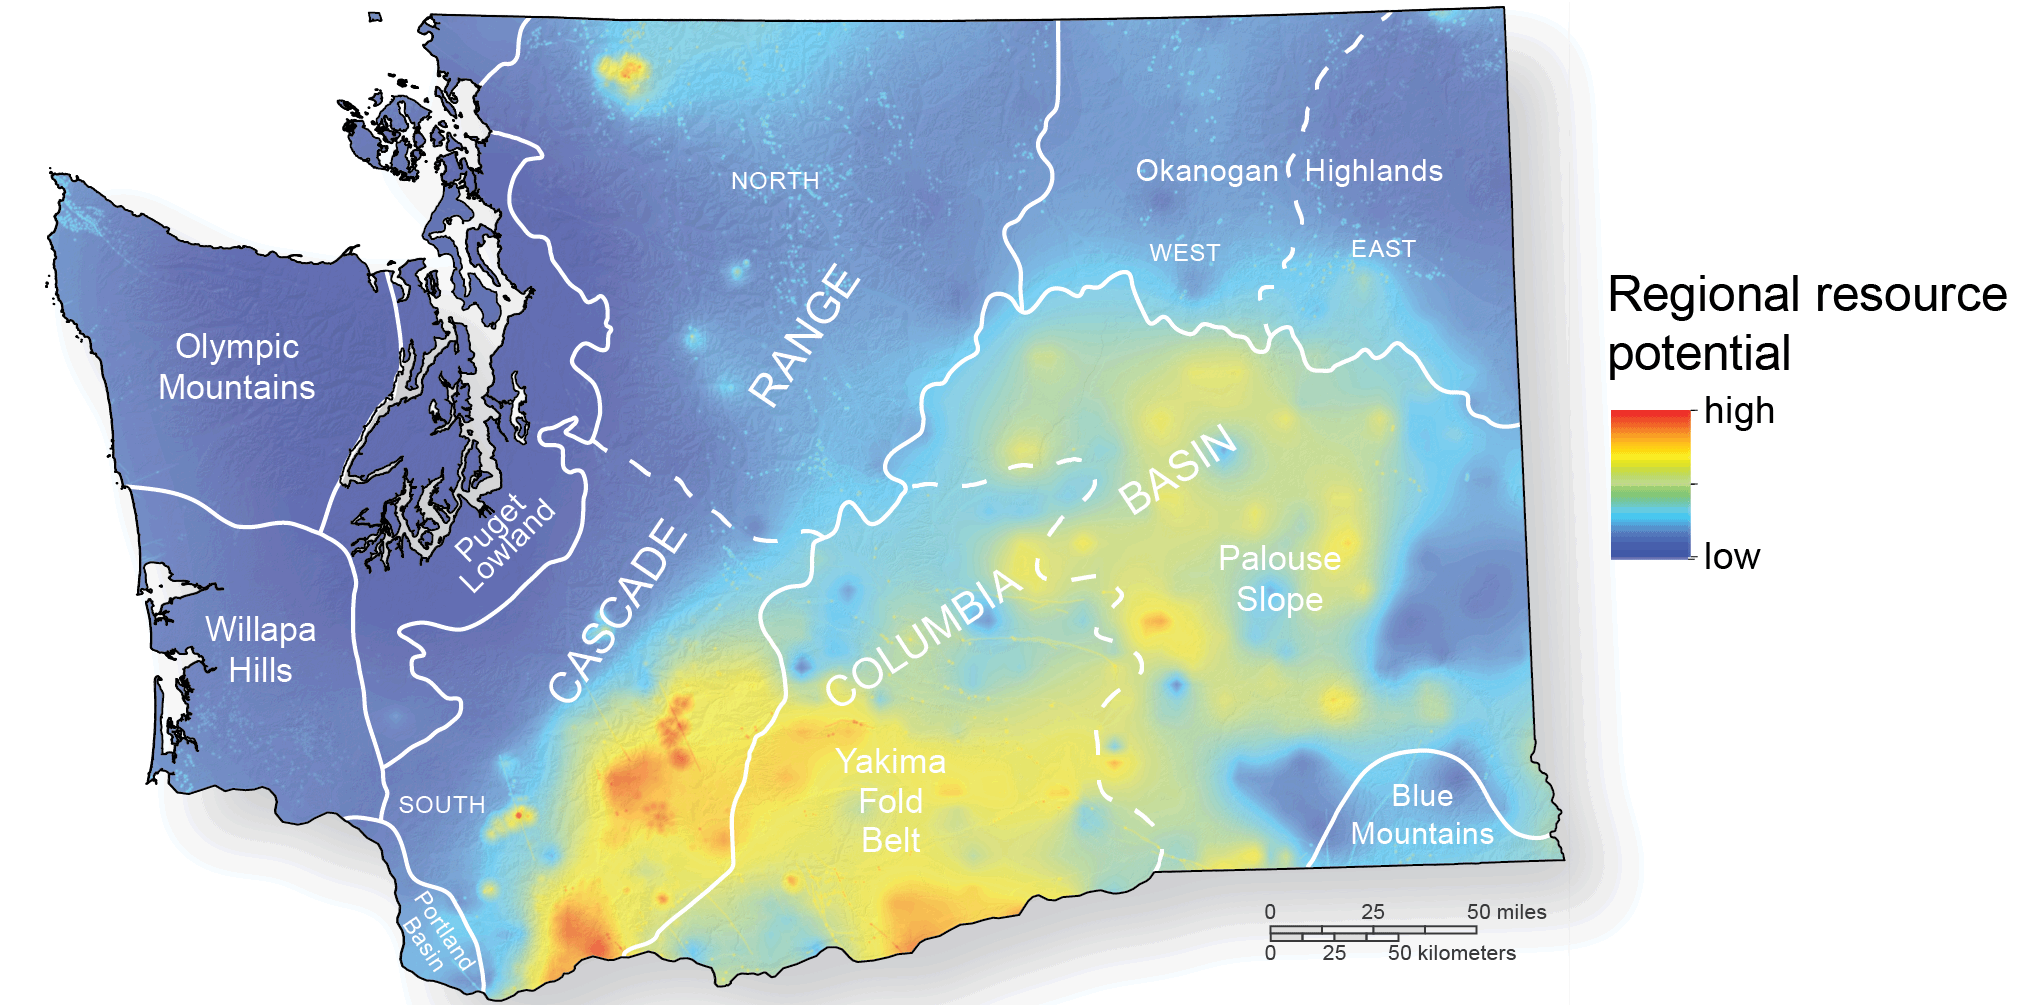
Geothermal favorability of Washington State.
In order to gain a broad understanding of the geothermal resource potential and favorability for development in Washington State, we have developed an approach to determine the spatial association between various geologic and thermal features, infrastructure, and land-use.
The color scale provides a ranking of favorability for exploration and development of moderate- to high-temperature geothermal resources. Warmer colors indicate higher favorability. The color scale is based on weighted raster overlay layers, including: (1) modeled geothermal potential; (2) proximity to transmission lines, and (3) elevation restrictions. The model is not meant to be used to locate areas for exploration on a site-specific basis, and should not be used at a scale greater than 1:250,000.
Download the Geothermal Favorability of Washington publication (OFR 2014-02).
Lidar
- Aspect
- Slope
- Hillshade
- DEM
- DSM
- DTM
- Lidar
- Point Cloud
- Point Density
- First Return
- Last Return
- Resolution
-
Aspect refers to the position of a feature in a specified direction. In terms of elevation data, the aspect is the direction in terms of degrees that the terrain is facing. For example, an aspect of zero describes terrain facing due North, while an aspect of 180 describes terrain facing due South.
Aspect derived from elevation data can be useful in planning assessments (how much sun exposure will a building receive) or for habitat analyses and modeling, as slopes facing a certain direction may receive more or less rain, for example.
See the Bare Earth story map and the lidar webpage to learn more about this.
-
Slope is a measure of the steepness of the terrain. It can be measured in terms of percent (for example, an 8% grade on a road) or in terms of degrees.
See the Bare Earth story map and the lidar webpage to learn more about this.
-
A hillshade is a grayscale rendering of the terrain which uses a simulated sun angle to shade and model the terrain features. A hillshade appears more like the terrain you might view from an airplane.
See the Bare Earth story map and the lidar webpage to learn more about this.
-
A DEM is an acronym for Digital Elevation Model. Similar to a digital image where individual pixels contain red, green, and blue values to describe the color of a feature at that location in space, a DEM pixel contains the height of the elevation at that location.
See the Bare Earth story map and the lidar webpage to learn more about this.
-
A DSM is an acronym for Digital Surface Model. This is a type of DEM that specifically describes the "top surface" elevation. If a loose blanket were draped over the topography, the DSM would represent the elevations of the topography taking into account trees, buildings, and towers.
See the Bare Earth story map and the lidar webpage to learn more about this.
-
A DTM is an acronym for Digital Terrain Model. This is a type of DEM that specifically describes the elevation of the ground surface, or a "bare earth" model. If all of the trees, buildings, vegetation and towers could be removed leaving only the bare ground beneath, the DTM would represent that topography.
See the Bare Earth story map and the lidar webpage to learn more about this.
-
Lidar is an acronym for Light Detection and Ranging. By pointing a laser at a surface at closely spaced intervals and measuring the time it takes for light to return to the source, very accurate three-dimensional information can be obtained with sufficient measurements. Billions of these measurements can yield an extremely detailed three-dimensional rendering of the terrain.
See the Bare Earth story map and the lidar webpage to learn more about this.
-
A lidar sensor sends out several light pulses per second and receives multiple returns from different objects from each pulse. The calculated position of a return is called a point. By calculating the position of every return, a "point cloud" can be derived to show the positions of all returns.
See the Bare Earth story map and the lidar webpage to learn more about this.
-
Point density is a measurement of the number of points (returns) per unit of ground distance. For example, if you counted the number of points in a point cloud within one square meter, the number would represent the point density. Or, if there are 10 points within a square meter in the point cloud, the density is "10 points per square meter".
See the Bare Earth story map and the lidar webpage to learn more about this.
-
When the sensor sends out a pulse of light, that light may illuminate multiple objects on the ground. The light then bounces off those objects and is returned to the sensor as returns or "points". The First Return is the first measurement to be received back by the sensor. Often, it might represent what the light pulse hit first, or what is tallest in the scene, such as a tree. First returns are also used to generate a Digital Surface Model.
See the Bare Earth story map and the lidar webpage to learn more about this.
-
Similar to first return, the Last Return is the last measurement to be received back by the sensor from a single pulse of light. Often, it represents the last object the light pulse hit, or what is furthest away in the scene, such as the ground surface. Last returns are used to generate Digital Terrain Models.
See the Bare Earth story map and the lidar webpage to learn more about this.
-
Resolution typically refers to the pixel size of an image. For example, a 3-foot resolution DEM means that each pixel represents a 3-foot by 3-foot cell on the ground. This is important information when working with DEMs because it helps define the level of detail that can be resolved in the scene. A 30-foot resolution DEM may only distinguish large buildings and features, whereas a 3-foot resolution DEM may identify smaller buildings, road surfaces and individual trees.
See the Bare Earth story map and the lidar webpage to learn more about this.
Exploration Geophysics
- Gravity
- Magnetics
- Ground-Penetrating Radar
- Seismic Surveys
- Resistivity
- Down-hole Geophysics
-
Gravity surveys identify density differences in rock formations. This is useful for identifying the depth of bedrock under unconsolidated sediment. Gravity surveys can also locate contacts between two distinct densities of rock at depth.
Gravity surveys are conducted in the field using many methods. Geologists set up a gravity base station as well as a mobile station to periodically compare the collected gravity data because of daily and hourly changes in Earth's magnetic field. This data is then used to calculate the gravity measurements.
Learn more about gravity on our Subsurface Geology page.
-
Geophysicists use magnetometers to identify magnetic contrasts in rocks. Magnetic surveys can be performed on the ground, but large areas can be covered using airplanes. Sharp contrasts in magnetic susceptibility can indicate faults, folds, or geologic contacts between magnetic and non-magnetic minerals.
Learn more about magnetics on our Subsurface Geology page.
-
Ground penetrating radar (GPR) is a method of imaging the subsurface using nondestructive radar pulses. The radio wave travels through the subsurface and bounces off of soil and rock layers. Faults, contacts between different rock types, and discrete objects like boulders or voids are then visible.
GPR has a variety of effective depths (generally less than 100 feet in depth) and resolutions, depending on the type of equipment used and soil conditions at each site.
Learn more about subsurface geophysics on our webpage.
-
Seismic surveys are commonly categorized as either active or passive. In active seismic surveys, the geophysicist creates a seismic wave by hitting the ground with a hammer or using an air-gun if in water. Small explosive detonations may also be used to create a seismic signal. In passive seismic surveys, the geophysicist uses naturally occurring seismic waves or "background noise", like the rumblings produced from trains or cars, as the seismic source. These data can help researchers identify faults and other structures, and aid in understanding the seismic hazards of our state.

All active seismic surveys, regardless of the size of the study, involve sound waves generated from sources that travel through the ground, are reflected or refracted, and are then received by detectors. The speed at which the waves travel tells us a lot about what layers are made of and how they are arranged.
Learn more about subsurface geophysics on our webpage.
-
The resistivity of a material is a measurement of its resistance to an electrical current. To test this, geologists introduce a current directly into the ground using electrodes. Different types of materials return different resistivity values. The data can be interpreted to tell geologists the depth of a water table, the composition of subsurface materials, identify faults, or characterize the leakage of fluids from fractures or other sources such as dams.
-
In order to learn even more about subsurface conditions, geologists sometimes conduct down-hole geophysics. This is done by lowering a probe down a well or borehole. The probe collects continuous data that is then graphically displayed on a computer log.
Different types of rocks, sediment, and fluid have diagnostic characteristics when bombarded with electrical, acoustic, or radiometric testing. Often combinations of one or more of these types of tests are performed within the same borehole to fully characterize the subsurface lithologies, moisture content, density, etc.
These logs are most often used by the oil and gas industry, but can also be used for geotechnical, geothermal, or environmental applications.